Support Center

EMVA 1288: Camera Sensor Review


Understanding The Results
The EVMA 1288 standard describes how to test and present imaging performance results and is one of the key pieces of information that can help you better choose a camera. Almost all machine vision camera manufacturers comply with the EMVA 1288 standard allowing you to compare and contrast camera performance across vendors. Accessing these imaging performance results are usually accessible and available on a specific camera model page. While the presentation might differ slightly across camera vendors, the parameters which are tested are the same. Our machine vision camera sensor review describes the most common parameters, how they affect image quality, and comparison results of all of our available camera models.
Mono Camera Sensor Comparison Charts - EMVA 1288 Results
Quantum Efficiency Sensor Comparison
Compare averaged LUCID mono QE measurements by sensor. Use the wavelength ranking for a quick comparison, then select up to 10 sensors in the QE Curve Explorer.
QE at a Selected Wavelength
Compare the average measured QE of LUCID mono camera models using the same sensor.
QE Curve Explorer
Select up to ten sensors. Hover over the curves to see the average, measurement range, and contributing LUCID camera models at each wavelength.
Dynamic Range
Higher is better. Hover over the data points for detailed information.
Dynamic Range (dB) Explained:
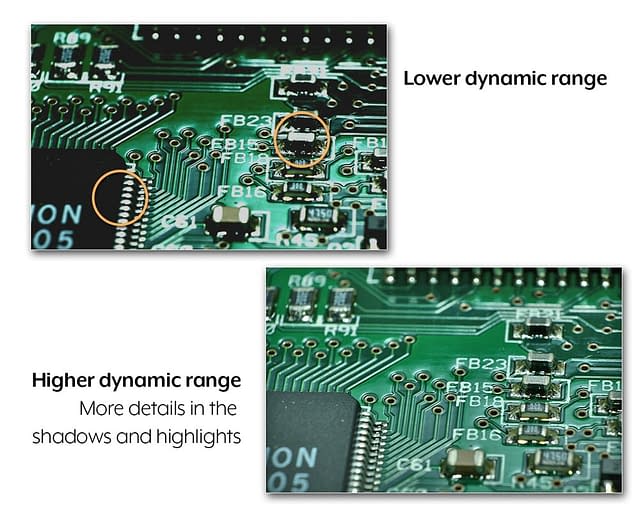
Dynamic range is the ratio of the maximum signal level (saturation capacity) to the minimum signal level (temporal dark noise) of the sensor. The higher the dB the better the sensor’s ability to show levels of grayscale detail from the brightest areas to the darkest areas in a scene. This is important when imaging scenes with both very bright and dark sections.
Saturation Capacity
Higher is better. Hover over the data points for detailed information.
Saturation Capacity (e-) Explained:
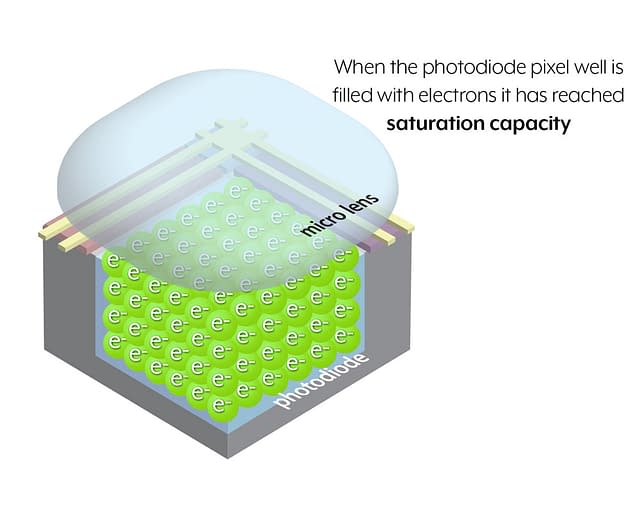
Each pixel contains a photodiode to convert photons to electrons. After conversion these electrons are also temporarily stored in the photodiode until they are transferred out. Saturation capacity measures the maximum capacity of the photodiode to hold these electrons. When capacity is reached, the sensor hits its maximum signal level and the electrons start to overflow and are discarded. A sensor that has reached capacity would result in a white image. Larger saturation capacity allows for more range in sensing levels of light.
Temporal Dark Noise
Lower is better. Hover over the data points for detailed information.
Temporal Dark Noise (e-) Explained:
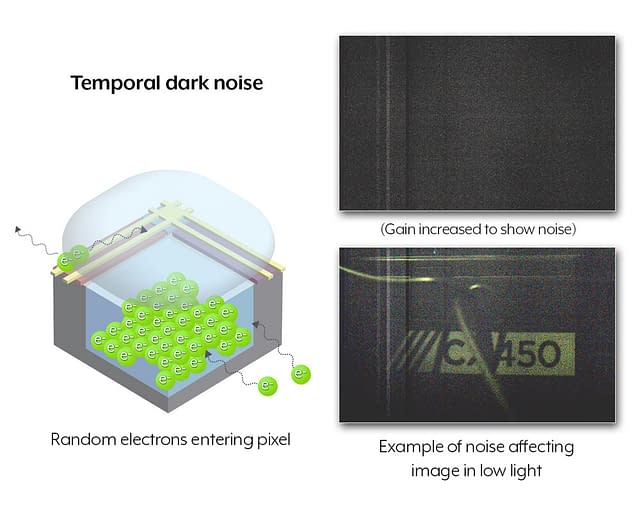
Temporal dark noise measures noise when no light is entering the sensor. Due to surrounding sensor electronics and pixel components, random unwanted electrons are created that can enter the pixel and pixel pipeline resulting in noise. Newer sensors employ better technology and pixel structures to help reduce noise and shield sensor components from thermal fluctuations. A lower temporal dark noise is better as it will result in cleaner looking images, especially in low light conditions.
Signal to Noise Ratio (SNR)
Higher is better. Hover over the data points for detailed information.
Signal to Noise Ratio (dB) Explained:
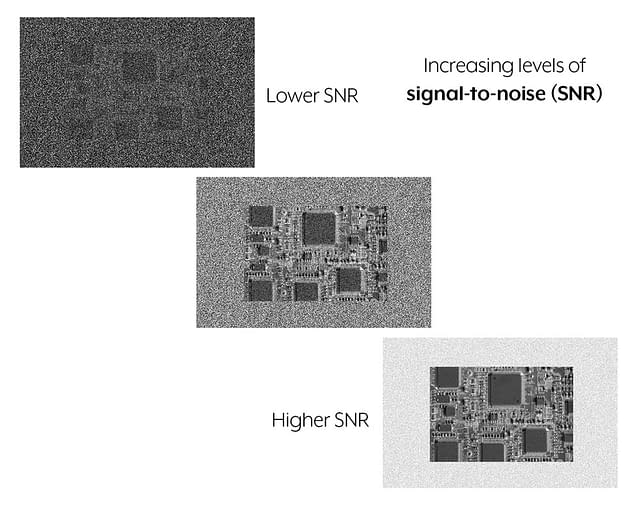
The signal-to-noise ratio, also known at SNR, measures how much useful image data is distinguished from temporal dark noise. For example, a result of 40 dB means that there is 40 dB of image data higher than the level of noise. The higher the SNR, the clearer the image is.
Absolute Sensitivity Threshold
Lower is better. Hover over the data points for detailed information.
Absolute Sensitivity Threshold (y) Explained:
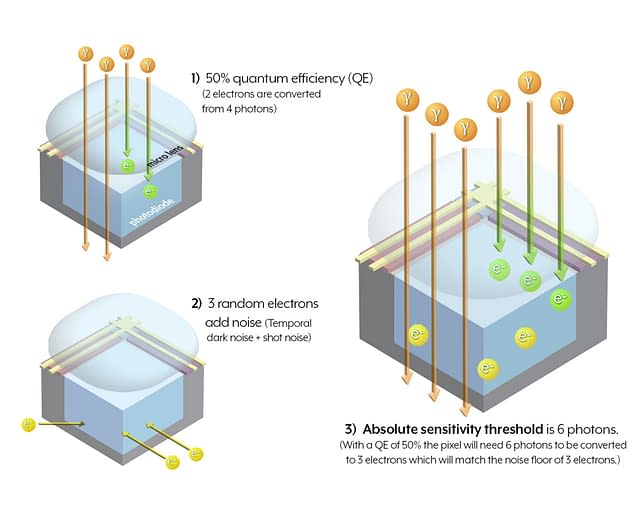
Absolute sensitivity threshold result shows the the lowest amount of light needed to go over the noise of the sensor. The lower the result the less light needed to differentiate useful imaging data from noise. Lower results produce better sensitivity in low light environments.